
[ Energy monitoring and efficiency platform ]
Every utility measured. Every saving proven.
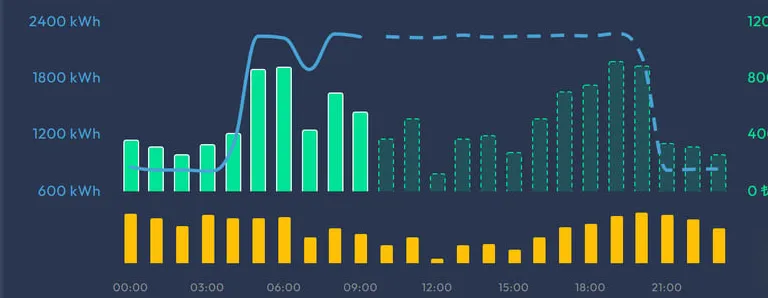
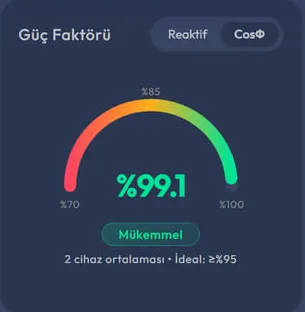
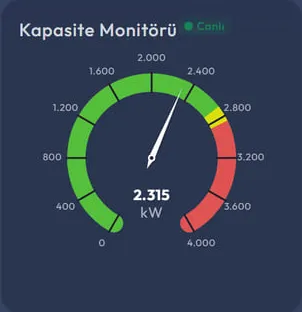
Compressed air, cooling, generators and steam — one platform, minute-level resolution. Every figure on the screen carries its source.
The problem
An energy bill shows the total, never the reason.
On most sites the utilities run on a single meter, often unmeasured entirely. The figure that arrives at month end will not tell you what actually cost the money: a leak, a set pressure that is too high, a machine idling, or simply more production.
While that question stays open, efficiency spending rests on guesswork — and guesswork either stops the investment or aims it at the wrong place. We take the answer from measurement.
Verified saving
One ice cream plant, 614 days.
The compressor house was renewed, the set pressure lowered, heat recovery brought online. The figures below are the consumption avoided over that period — measured against a reference period and calculated phase by phase.
-
1,361,823 kWh
Consumption avoided
-
6,827,306 TRY
Cost avoided
-
4.09 yrs
Payback period
The calculation is kept open. The reference period is real meter data; the final phase’s monthly consumption was not measured but derived from the pressure difference, and is labelled "derived" in the platform. The payback period is calculated without incentives — the investment incentives actually used were left out, and including them would shorten it. Heat recovery assumes all recovered heat was used; that is the programme’s one optimistic assumption, and the platform says so too.
What we measure, from where, at what resolution
Every module runs on the same measurement layer. This is the raw data from the floor; everything else is built on top of it.
Measurement plate
- Field reading
- 1 min
- Analysers, transmitters, machine controllers · Modbus RTU/TCP
- Site gateway
- cellular
- Panel-mounted · carries data over MQTT
- Meter data
- hourly kWh
- Distribution operator · index and demand
- Market data
- per MWh
- Day-ahead price and renewable levy
- Outdoor air
- °C · %RH
- Hourly meteorology · by site location
- Retention
- 90 days raw
- Hourly and daily summaries kept indefinitely
Data stays on our own infrastructure. There is no dependency on equipment vendors’ cloud services, and if you remove the installation your history stays with you.
Solutions
Same data, different questions.
- 01
Compressed Air and Compressor Monitoring
What is compressed air actually costing us, and how much of it is leaking away?
- 02
Chiller and Cooling System Monitoring
How efficiently did the cooling plant actually run today?
- 03
Generator and Standby Power Monitoring
If the power failed right now, would the generator take the load?
- 04
Electricity Bill Validation
Is the bill that arrived this month actually right?
Method
Measuring on its own is not enough.
Plenty of systems collect data from the floor. The difference lies in whether that data ever becomes a judgement. Without all four steps, monitoring is an expensive chart on a screen.
-
01
Measure
Power analysers, transmitters and machine controllers are read every minute. A site gateway carries the data to the platform — no extra PC or local server required.
-
02
Derive
A raw reading means little on its own. Specific energy, COP, leak rate and the expected invoice are all calculated at this layer.
-
03
Compare
Each derived value is held against a reference: the machine’s datasheet curve, the site’s own history, or the line items on the invoice that arrived. A number without a reference decides nothing.
-
04
Alert and report
When a deviation clears the threshold an alarm opens and an email goes out. Monthly reports are built on the same calculation — what you read in the report comes from the same source as what you see on screen.
Every figure is shown with its provenance: measured, derived or estimated. The three are never presented as equivalent.
Let us measure what is happening on your site.
In a one-hour call we look at your existing setup and set out exactly which measurement points are needed and what you would be able to see.